 2015 2015 | 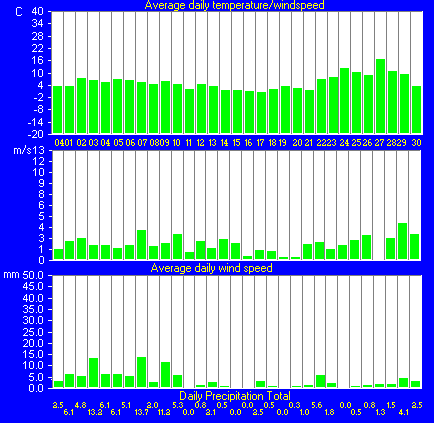 2016 2016 |
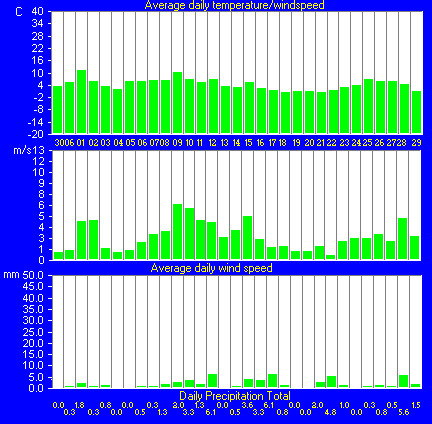
These two charts show the average daily temperature, wind speed and rainfall for January 2015 and 2016. Click on the chart to open it in a new window
- Can you see any big differences or similarities?
- Is there a better way of displaying this data that would make the comparison easier?
No Comments Yet