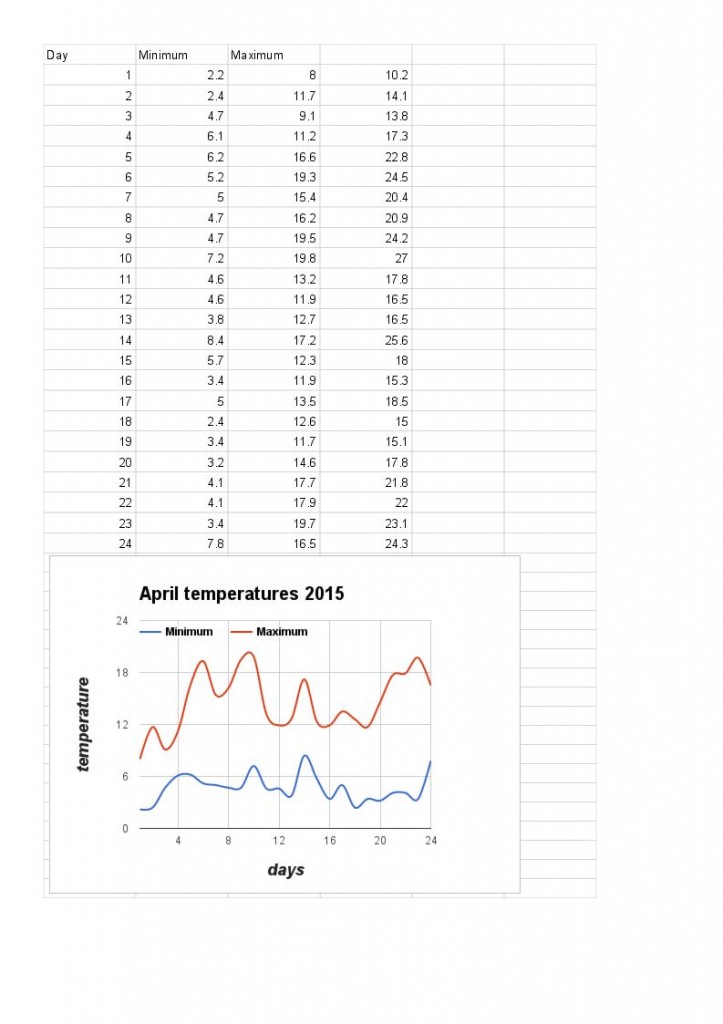
Hans has recorded and plotted a graph for the minimum and maximum temperatures in April using Google Sheets. The final column shows the total of the minimum and maximum temperatures.
April 2015 – Minimum and maximum tempera

Hans has recorded and plotted a graph for the minimum and maximum temperatures in April using Google Sheets. The final column shows the total of the minimum and maximum temperatures.
April 2015 – Minimum and maximum tempera
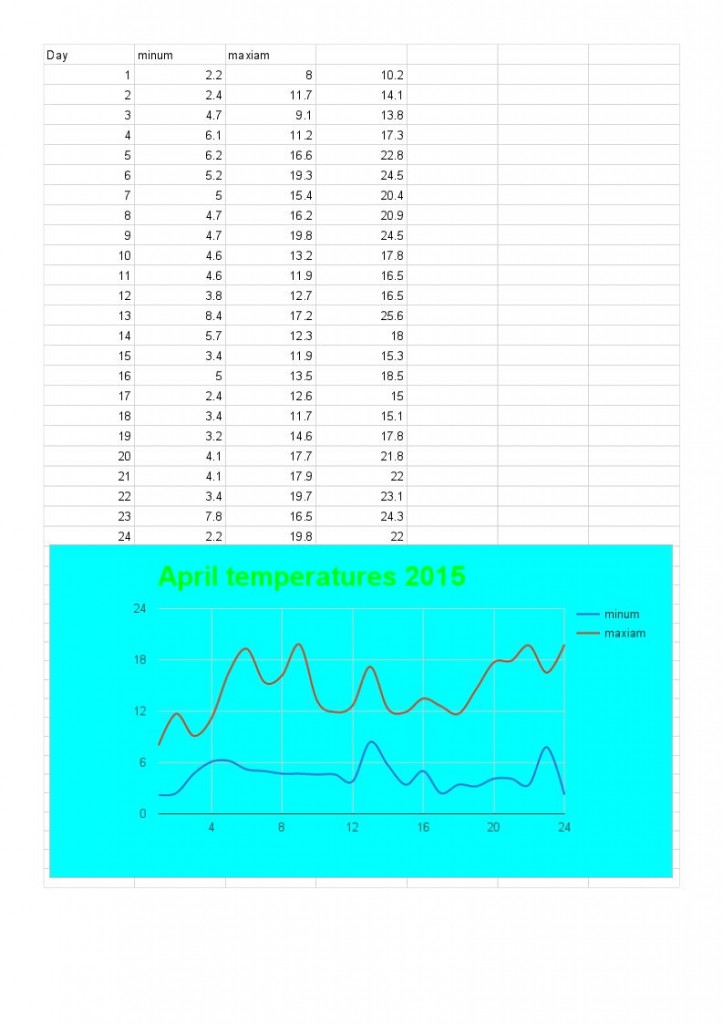
Antonio has recorded and plotted a graph for the minimum and maximum temperatures in April using Google Sheets. The final column shows the total of the minimum and maximum temperatures.
April 2015 – Minimum and maximum tempera

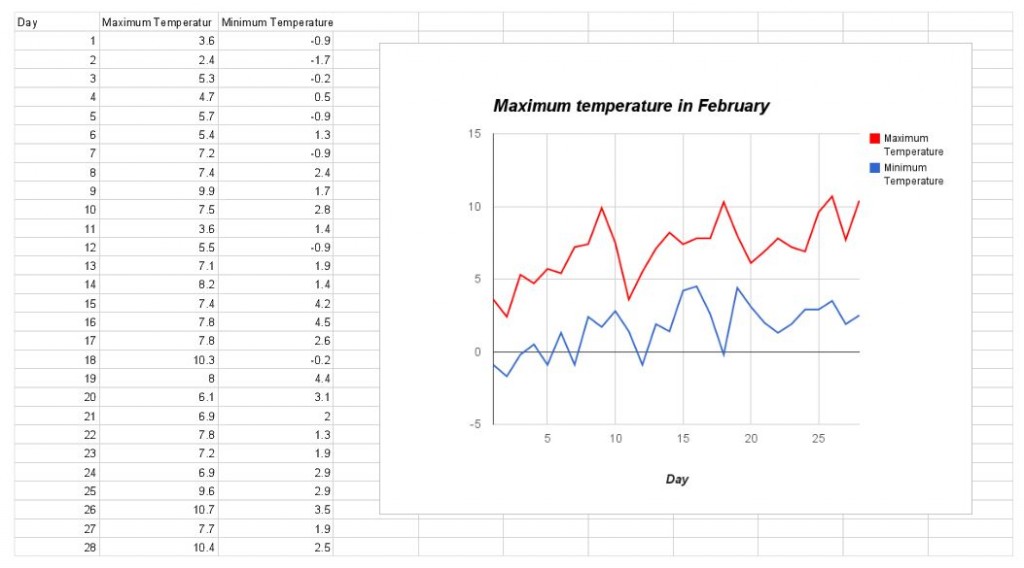
Rachel has recorded and plotted a graph for the minimum and maximum temperatures in April using Google Sheets. The final column shows the total of the minimum and maximum temperatures.
March 2015 – Minimum and maximum tempera

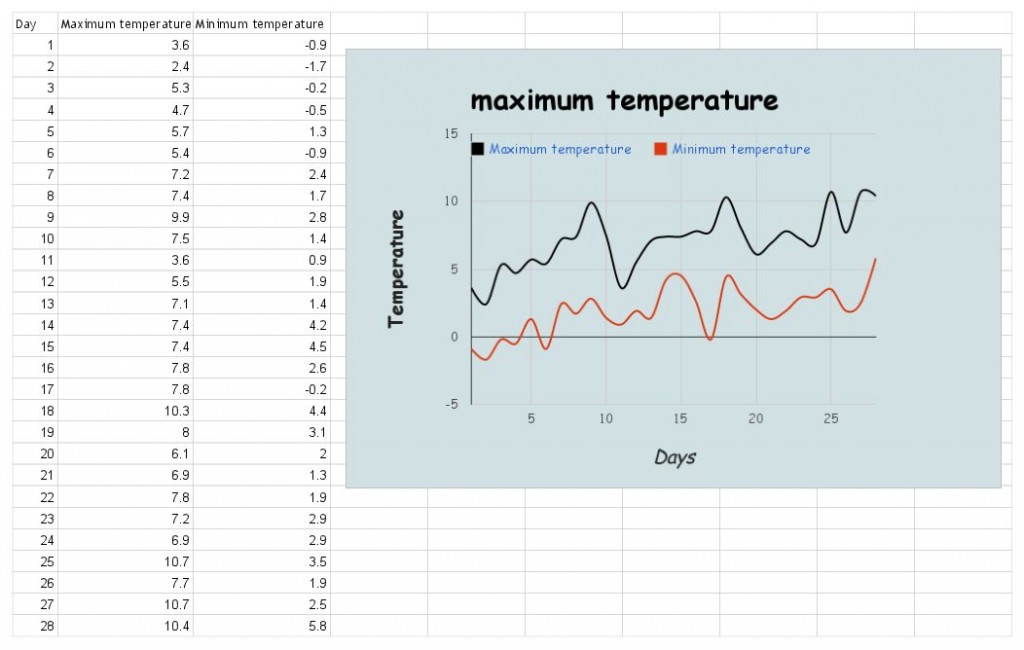
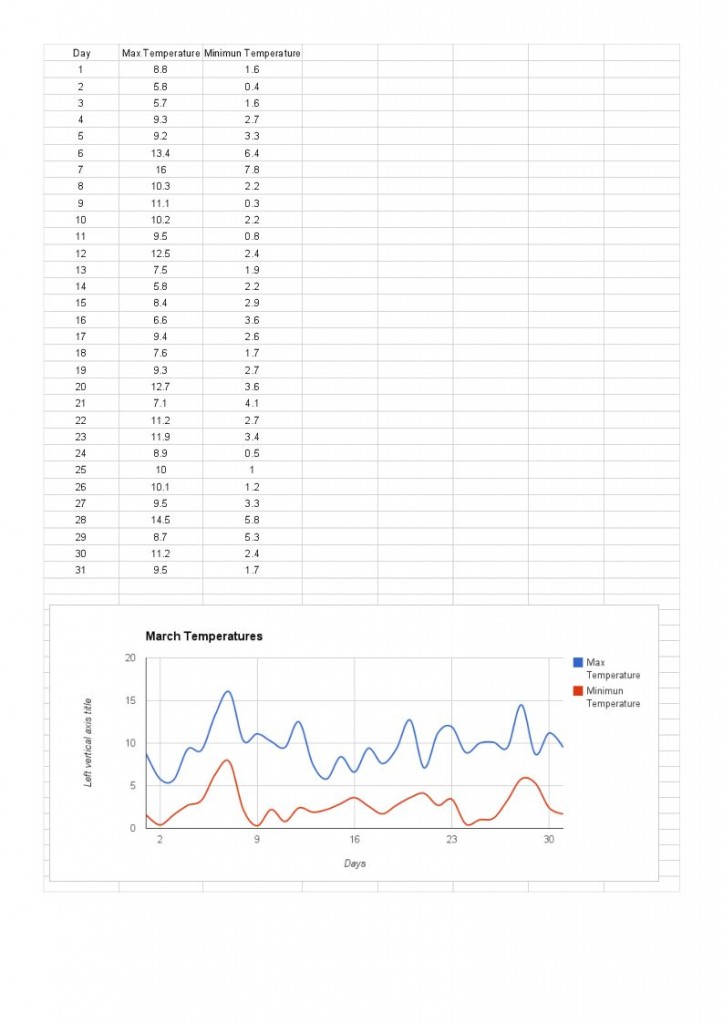
Megan has recorded and plotted a graph for the minimum and maximum temperatures in March using Google Sheets. March 2015 ACE Temperatures – Megan
March 2015 – Minimum and maximum tempera
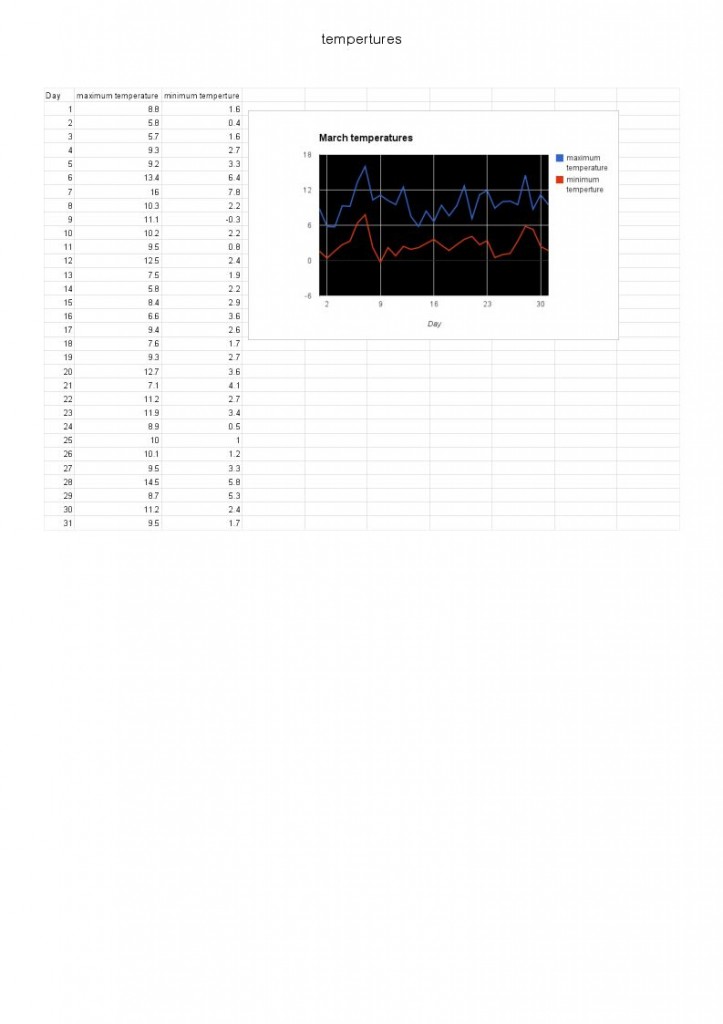
Hanssel has recorded and plotted a graph for the minimum and maximum temperatures in March using Google Sheets. March 2015 ACE Temperatures – Hanssel
March 2015 – Minimum and maximum tempera
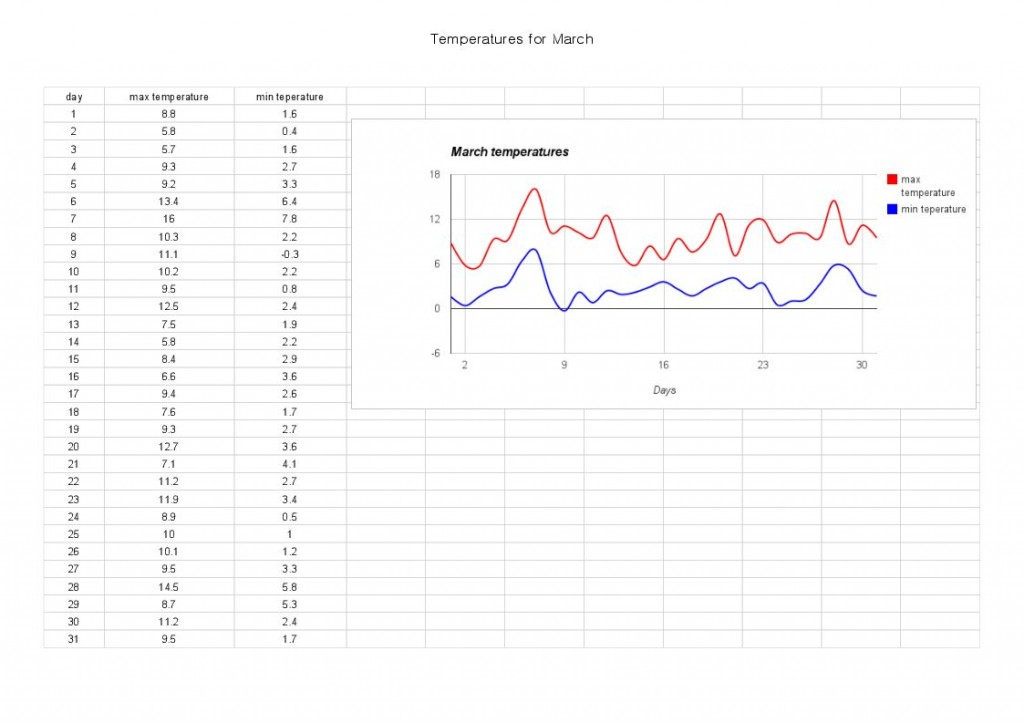
Daniel has recorded and plotted a graph for the minimum and maximum temperatures in March using Google Sheets. March 2015 ACE Temperatures – Daniel
March 2015 – Minimum and maximum tempera
Adam has recorded and plotted a graph for the minimum and maximum temperatures in March using Google Sheets. March 2015 ACE Temperatures – Adam