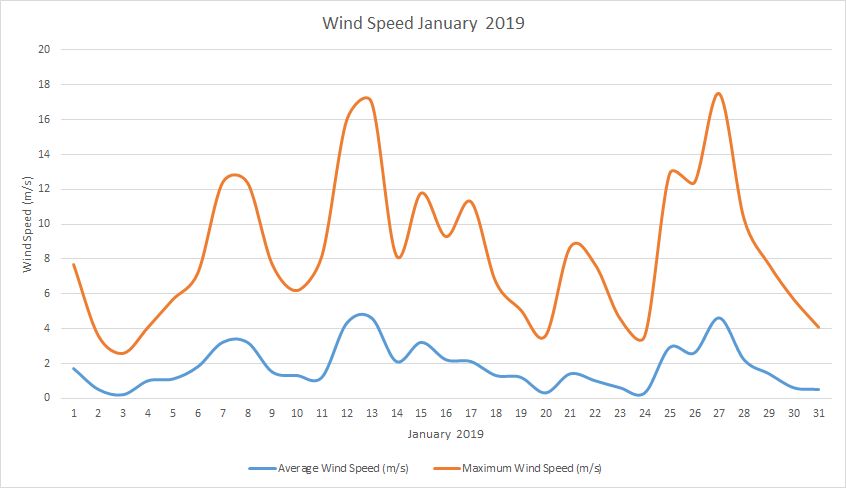
Temperature January 2019
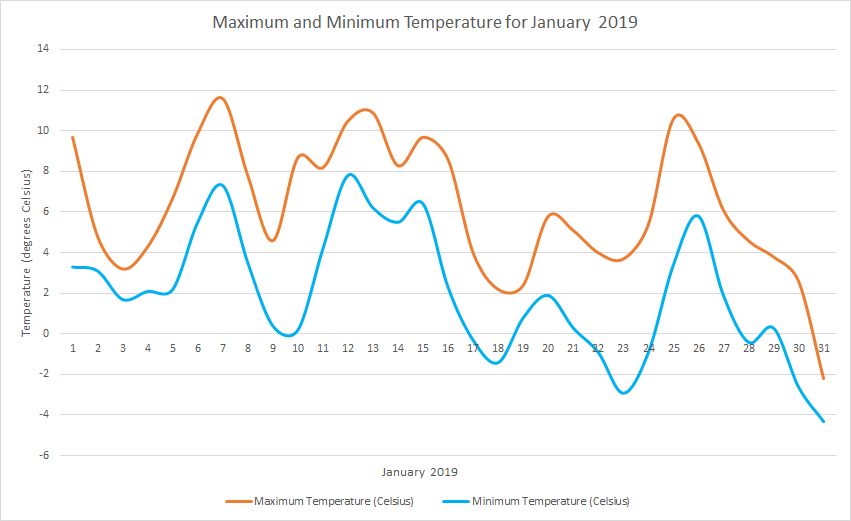
Daily Report For January 2019

Averages\Extremes for day :01 ———————————————————— Average temperature = 7.2°C Average humidity = 81% Average dewpoint = 4.1°C Average barometer = 103.5 kPa Average windspeed = 1.7 m/s Average gustspeed = 2.9 m/s Average direction = 345° (NNW) Rainfall for month = 0.0 mm Rainfall for year = 0.0 mm Rainfall for day = 0.0 mm […]
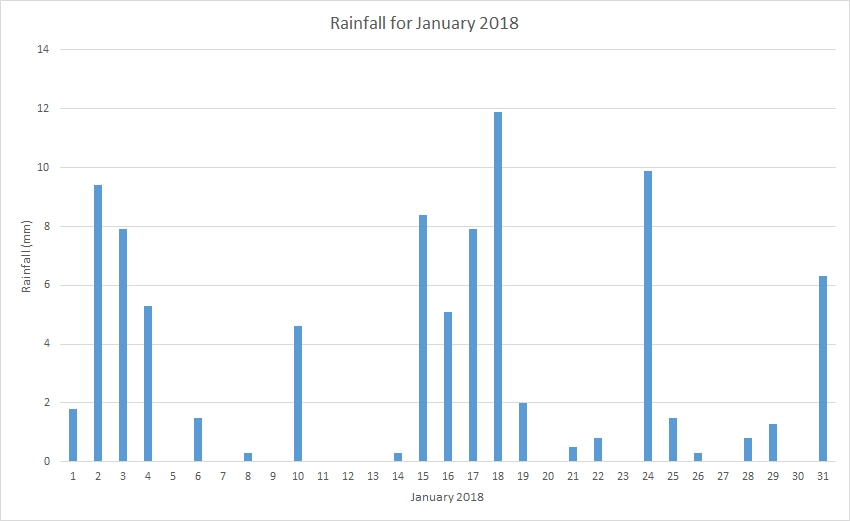
Rainfall January 2018
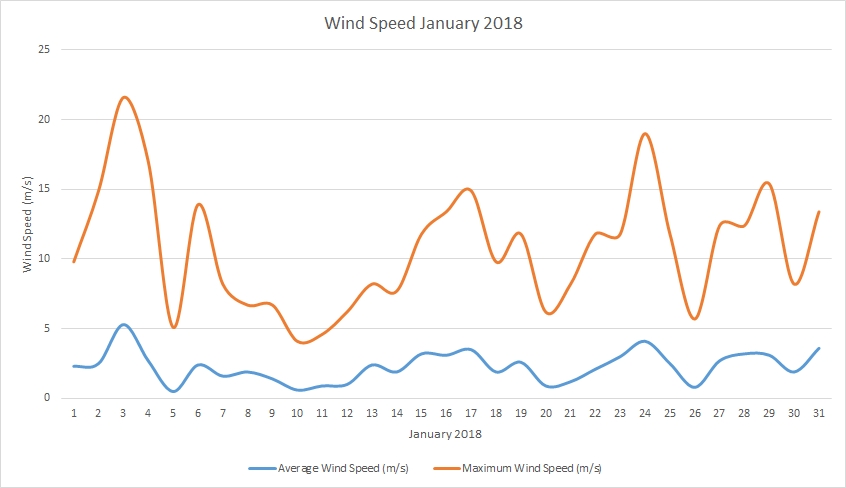
Wind speed January 2018
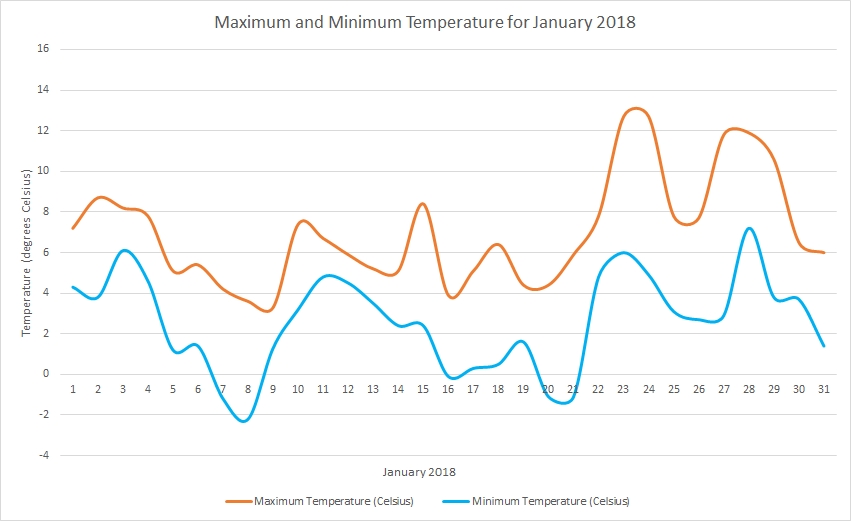
Temperature January 2018
Daily Report For January 2018
Daily Report For January 2018 Averages\Extremes for day :01 ———————————————————— Average temperature = 5.3°C Average humidity = 87% Average dewpoint = 3.3°C Average barometer = 99.3 kPa Average windspeed = 2.3 m/s Average gustspeed = 3.7 m/s Average direction = 280° ( W ) Rainfall for month = 1.8 mm Rainfall for year = 1.8 […]